(If you’re interested in watching me talk through this post, as opposed to reading it then it’s been recorded as part of my plenary address at the Society for Open, Reliable and Transparent Ecology & Evolutionary Biology (SORTEE) conference in summer 2024 which you can watch right here)
Science is built on trust. Trust that your experiments will work. Trust in your collaborators to pull their weight. But most importantly, trust that the data we so painstakingly collect are accurate and as representative of the real world as they can be.
And so when I realized that I could no longer trust the data that I had reported in some of my papers, I did what I think is the only correct course of action. I retracted them.
Retractions are seen as a comparatively rare event in science, and this is no different for my particular field (evolutionary and behavioral ecology), so I know that there is probably some interest in understanding the story behind it. This is my attempt to explain how and why I came to the conclusion that these papers needed to be removed from the scientific record.
Social spiders have social niches.
The genesis of this whole series of papers grew out of some experiments I did during my Ph.D. My dissertation was all about testing theories on the adaptive evolution of individual differences in behavior. One of my favorite hypotheses in this regard was the “social niche specialization hypothesis” (Bergmuller & Taborsky 2010; Montiglio et al 2013). I first tested this in threespine sticklebacks, my main study species at the time, but somewhat surprisingly (at least to me at first) I found that sticklebacks show strong individual differences in behavior, but repeated social interactions within the same group do *not* seem to strengthen these differences, a key prediction of the hypothesis (Laskowski & Bell 2014). So I reasoned that if social niches were going to be important, they would be most important for species that have more stable social groups; unlike the sticklebacks that live in dynamic groups with constantly changing group membership.
So the summer after I performed my stickleback experiments, I approached Jonathan Pruitt at the 2012 ISBE conference being held in Lund, Sweden. I told him about my ideas and most importantly, how I thought his social spiders were *ideal* for testing these predictions. The spiders live in the same social group their whole lives and have to cooperate for lots of tasks, so if social niches are important for generating individual behavioral differences, they would probably be most important for species like these spiders. At the conference, we outlined the experimental design and talked about our predictions and then we parted ways, me back to Illinois to finish up my dissertation, him to his lab in Pittsburgh.
Eight months later Jonathan sends me a datafile containing the behavioral data he collected on the colonies of spiders testing the social niche hypothesis. In a nutshell, we had colonies of spiders where they either lived with their same social group for the whole time (control) or got mixed up into new colonies with new members (mixed) after certain amounts of time (1, 2, 3, or 4 weeks). Jonathan measured the “boldness” behavior (latency of the spiders to resume movement after being scared) five times after this treatment. The key prediction was that the repeatability of behavior should be highest in the control colonies, and then increase in the mixed colonies with increasing tenure with their groups. This would support the idea that repeated social interactions with the same group of individuals canalizes individuals into predictably behaving in certain ways, that is, they would develop a social niche.
Once I got the data, I did all the standard data exploration – histograms, boxplots, dotcharts, pair plots. There was an excess of 600 values, which was expected given that the trials were stopped at 10 minutes (600 seconds). But otherwise, it looked like there was good variation in the data and I was ready to run my models. The main test was to estimate the repeatability of this boldness behavior in each of the treatment groups. I think my heart jumped into my throat when I saw the first results. You can see that control colonies (in black) always have high repeatability, and that mixed colonies (in gray) have low repeatability until they’ve lived together for at least 3 weeks and then repeatability is recovered! This was such strong support for the social niche hypothesis and demonstrated in such a clean way! The paper was honestly a breeze for me to write up as the predictions were so clear and the results so straightforward. The paper was published in Proceedings of the Royal Society B (Laskowski & Pruitt 2014). This then led to a follow-up study published in The American Naturalist showing how these social niches actually conferred benefits on the colonies that had them (Laskowski, Montiglio & Pruitt 2016). As a now newly minted PhD, I felt like I had successfully established a productive collaboration completely of my own volition. I was very proud.
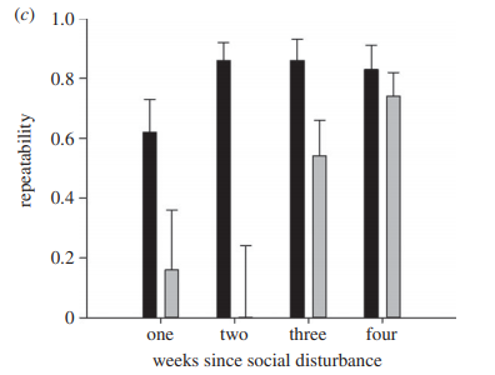
(Fig 2 in Laskowski & Pruitt 2014)
A simple request.
So that set of papers was published several years back (2014-2016). I have since moved on to other questions with other critters, but I still viewed that as a productive, effective collaboration.
Flash forward now to late 2019. I received an email from a colleague who had some questions about the publicly available data in the 2016 paper published in Am Nat. In this paper we had measured boldness 5 times prior to putting the spiders in their familiarity treatment and then 5 times after the treatment.
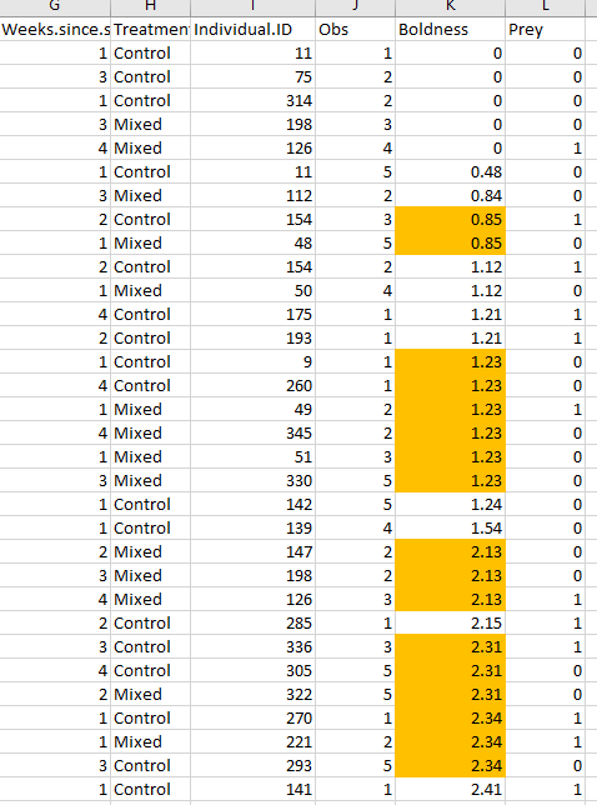
The colleague noticed that there were duplicate values in these boldness measures. I already knew that the observations were stopped at ten minutes, so lots of 600 values were expected (the max latency). However, the colleague was pointing out a different pattern – these latencies were measured to the hundredth of a second (e.g. 100.11) and many exact duplicate values down to two decimal places existed. How exactly could multiple spiders do the exact same thing at the exact same time? I looked at the data file that I had used for analysis (and was deposited on Dryad). I had put it in a “long” format (each observation of each individual has its own row) which is easiest for the linear models I had to run. I just sorted the data based on the boldness values prior to the treatment (“pre.boldness”) and it was quickly obvious that there were many repeat values. The same was true when I did this for the post.boldness measures too.
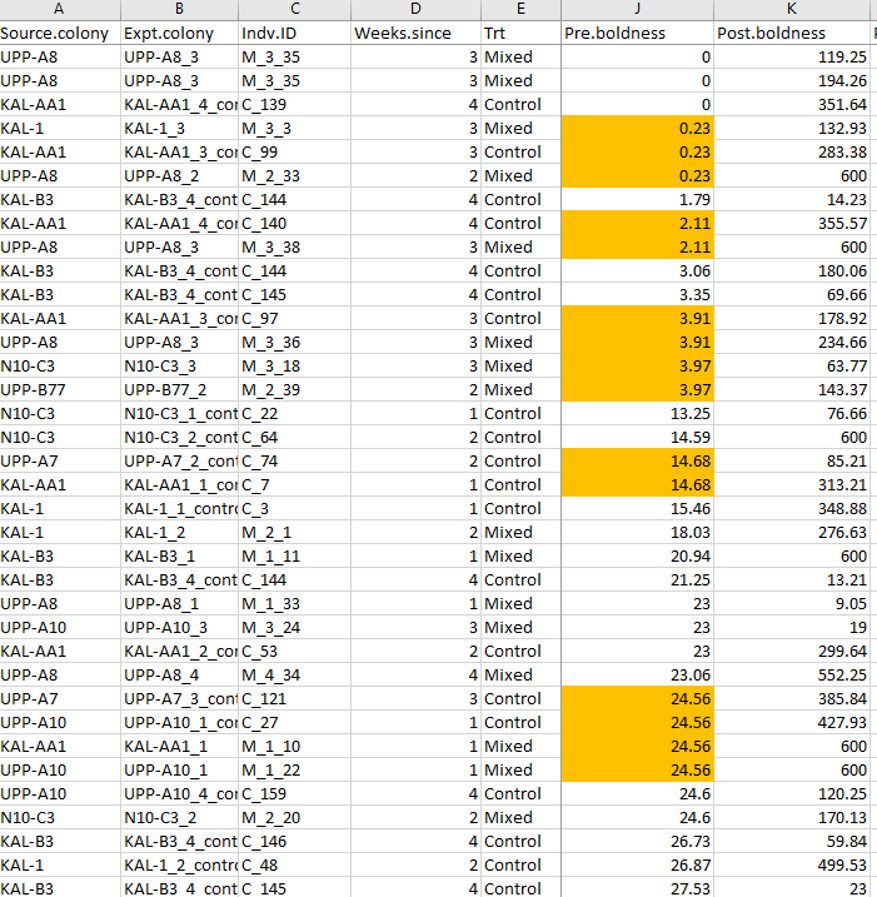
While Jonathan and I had come up with the idea for the experiments together, the data were solely collected in his lab. When asked what was producing this pattern, Jonathan’s explanation was quick and methodological – the spiders were actually measured in blocks. That is, multiple spiders were observed simultaneously and if two spiders did the behavior at basically the same time, they were given the same score (e.g. four spiders recovered at 24.56 seconds in the example above). This explanation appeared sufficient, though it did seem a bit sloppy to me: Jonathan had not previously told me he measured them in blocks, which if he did would have been very easy to account for statistically. It also seemed silly to record to two decimal places when he didn’t really have that level of precision. But in any case, I was relieved that there seemed a relatively “easy” explanation for this.
Jonathan quickly wrote up a correction to our article explaining the difference in reported methodology. However, at this point, for my own peace of mind, I decided to dive back into the raw data and just confirm to myself that everything fit this explanation so I could feel comfortable with the correction that Jonathan wanted to publish.
Retracting the Am Nat paper
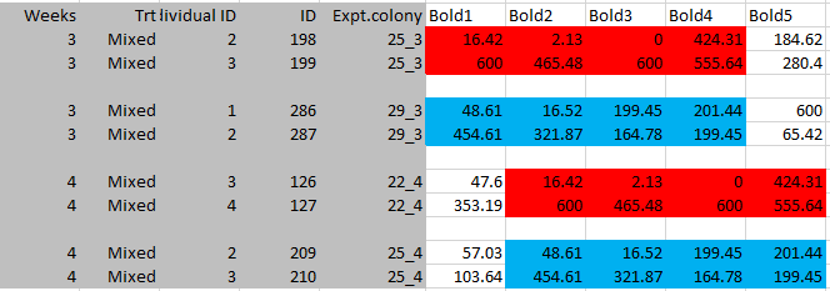
To start, I went back to the original excel file that Jonathan had first emailed me in June of 2014 . This data was in the “wide” format so each spider had its own row and then multiple columns for the 10 observations. My thought was that if the spiders with the same values were measured in blocks, then the values should all occur in the same observation (i.e. the same column). However, as I was perusing this file, I instead noticed an unexpected pattern of duplication in our mixed colonies that had been disturbed four weeks ago.
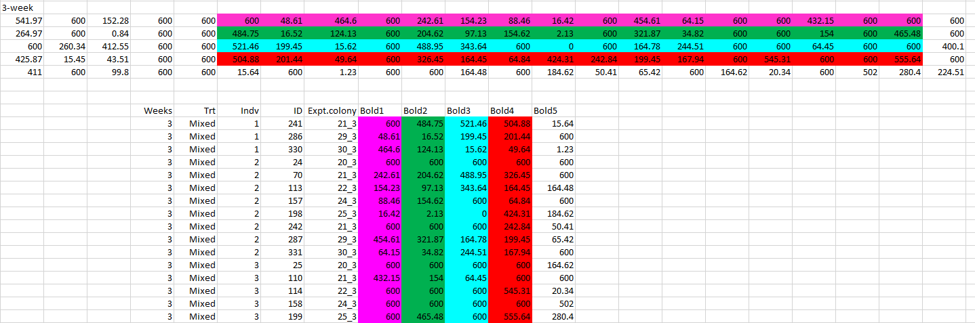
Here you can see the five measurements before the treatment, and the five measurements after (separated by a gray column). Each line is an individual spider. What I noticed is that the last two pre-treatment values, seemed to be identical to the first two post-treatment values in many spiders in this treatment. I colored those values red here. I also noticed that many values were very similar, but off by one digit in the hundreds column, e.g. 77.65 became 477.56. Those values I colored in yellow.
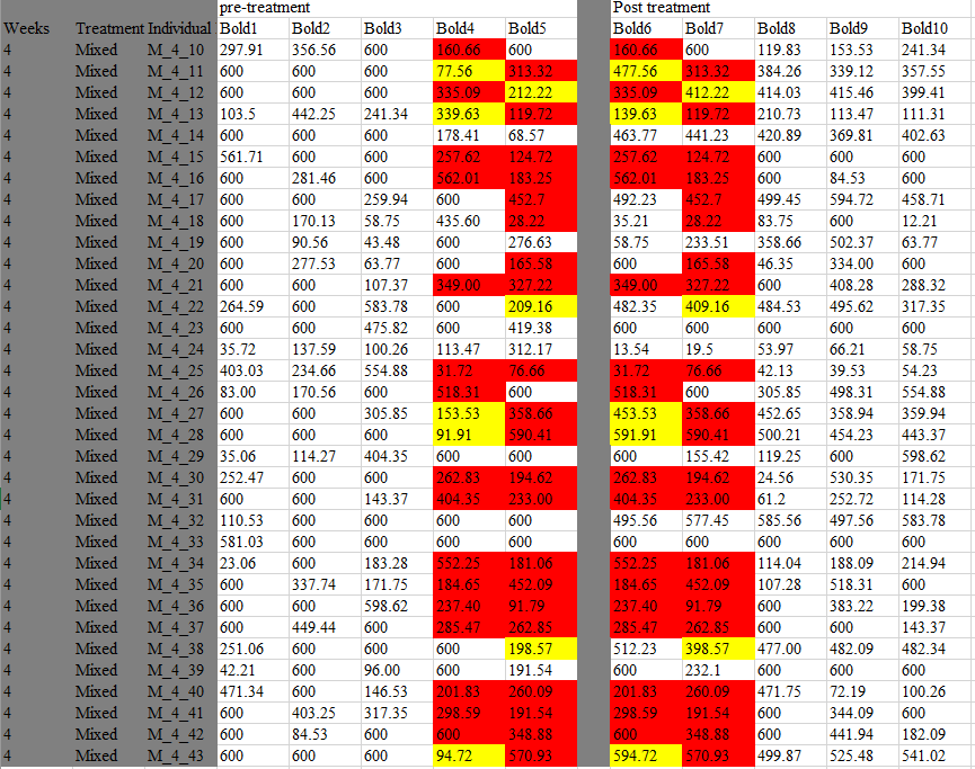
This pattern could not be explained by a block design. If the duplicate values are a result of two spiders being observed doing the same behavior in the same trial (block design), then the duplicate values should all occur in the same observation. A block design cannot account for how duplicates would occur in the *same* spider in observations that were separated by our 5-week familiarity treatment.
Then, just using the ‘find’ function in excel I looked to see where other duplicate values occurred in the data set. What I found was that it wasn’t just single values that were duplicated (which is what it had initially appeared when I just sorted the data in the long format, above), but rather it was whole sequences or sets of numbers that were duplicated. I color-coded just one example below.
After spending days looking at and color coding this data file, I realized that these duplicated sequences were incredibly common. Many of the sequences were duplicated across the pre- and post-treatment time points as well. When all values that were involved in any duplication were removed from the data, this removed fully 73% of the data. There were 3480 total observations in the dataset, but only 944 were unique values. Taken together, this pattern cannot be explained by a block design and also, as far as I can tell, appears biologically impossible.
The other co-author on the paper, PO Montiglio and I talked extensively about what I had found, and he and I both agreed, since we couldn’t figure out what was causing the problems in the data, we couldn’t correct it, and this meant that any of the results from our paper were invalid. When I asked Jonathan, he agreed, saying that the “repeat sequences… render the whole thing unreliable.”
I contacted Dan Bolnick, the editor-in-chief at the American Naturalist, and explained to him the problems I had uncovered in the dataset, and how we felt that a correction to the article was insufficient. The entire article needed to be retracted.
Digging deeper.
I previously mentioned that this Am Nat article was actually the follow-up study to the original study that was published in Proc B. So at this point, I decided that I needed to also investigate that data given that we had used the same experimental design and collected the same type of behavioral data.
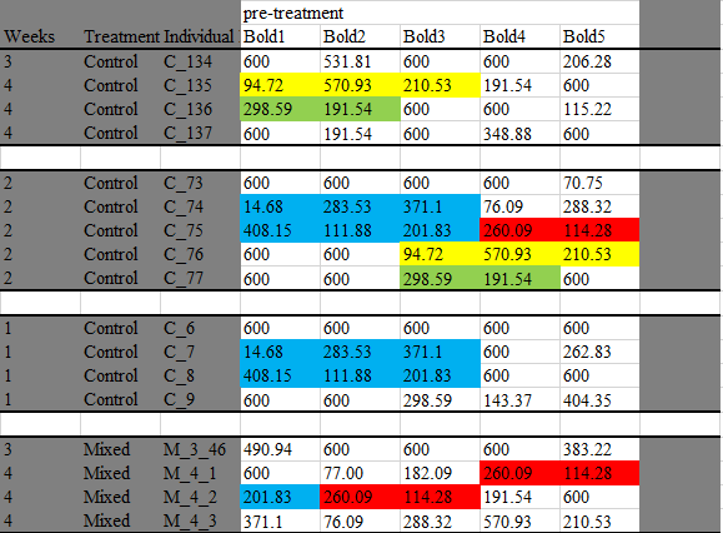
A quick sorting of this data showed that duplicate values also existed in this data set (above). So now I started to look to see if the duplicate *sequences* were also there. Here is an example below of just two sets of duplicate sequences (there are many more in the dataset).
I then discovered a final thing in this Proc B dataset. I was doing all of this data investigation and color coding in the original excel file that Jonathan sent me in March of 2013. You know how excel files can often have multiple spreadsheets? All the raw data was in Sheet 1, so I clicked on Sheet 2 expecting it to be blank and a perfect spot to write down all my notes to myself about the irregularities in the dataset. However, this sheet was not blank. Apparently I had never clicked on Sheet 2 before because I had never noticed these numbers before (when I got the data, I pretty quickly saved it as a .csv file which is easier to manipulate in R, but only saves the first sheet).
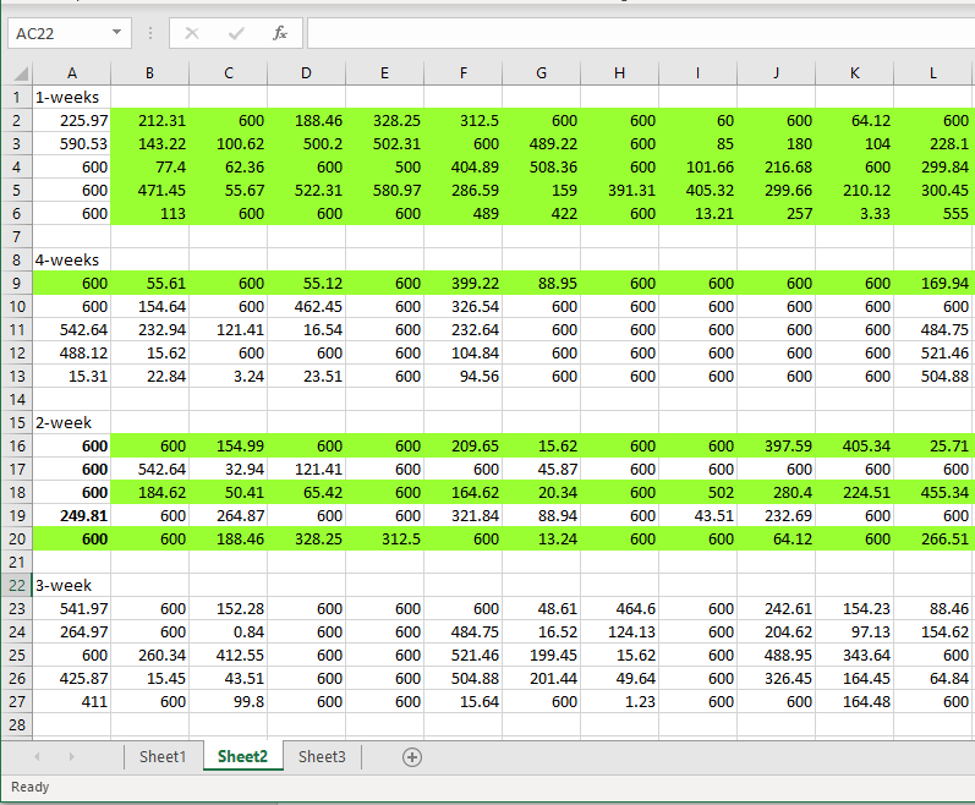
This (above) is exactly how it looked when I clicked on it. It took me a minute, but I realized that I was looking at the data for our mixed treatment colonies (only), but as opposed to being formatted in columns as on Sheet 1, these values were transposed – so that the columns became rows. Since I knew that duplicate values existed on Sheet 1, I decided to look for them on Sheet 2.
Here on Sheet 2, the duplicate sequences were not just sequences of 4 numbers (as they were on Sheet 1), but rather I could now see that in fact there were whole blocks of duplicated sequences. I highlighted the two largest blocks below (there are others). You can even see that one line of duplicated numbers appears three times (the green line). I think it’s important to reiterate that I did not change the numbers, or ordering of the numbers found on this Sheet in any way.
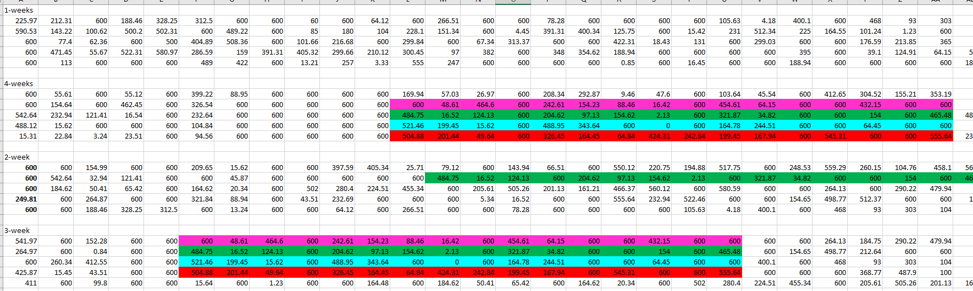
And below I color coded everything so you see how these transposed values on Sheet 2, line up with the raw data I used for analysis that was found on Sheet 1.
“Why Sheet 2 exists is an interesting question,” was Jonathan’s response and he agreed that “it is well that the paper is being retracted” when I asked him directly about this and that perfectly sums up my feelings as well. I should also mention that the duplicated blocks I highlighted and indeed the vast majority of these duplications occurred in the Mixed 3 and 4 treatments, that is in the treatments that showed that high repeatabilities were recovered due to increasing familiarity (Fig 2 above). When I removed these duplicated values, these main results no longer held – repeatability was instead low in all mixed colonies regardless of when the social disturbance occurred. While I’m not sure what Sheet 2 means or why it exists; I do know that the data in this paper also suffer from inexplicable irregularities rendering any results untrustworthy. This is why I pushed to retract this paper as well.
Finally, there is a third paper in this set (Modlmeier et al 2014) that was published in Biology Letters. There were many duplicate values in this data, but I did not immediately find duplicated *sequences* in the raw data (i.e. Sheet 1) of that paper. However, when I transposed the data as shown on Sheet 2 above, several rows of duplicated sequences became apparent. The editors at Biology Letters are aware of the problem and we are currently taking next steps with that paper. (UPDATE Feb 19,2020: This paper has also now been retracted).
I’d also like to note that since the first retraction (the Am Nat article) has been made public, several of Jonathan’s other co-authors have reached out to discuss potential issues in their own papers that they have collaborated on with him. Given the problems in my data sets, these folks are proactively investigating data that they received from Jonathan and are communicating with the relevant journal editors about any necessary next steps they may have to take. It seems that everyone’s top priority is to ensure the integrity of the scientific record.
Moving forward.
This has been an agonizing experience for me, and I assume everyone involved. Knowing that our data were no longer trustworthy was a very difficult decision to reach, but it’s critical that we can stand behind the results of all our papers. I no longer stand behind the results of these three papers.
I am now trying to focus on any potential positive benefits of this experience. This has been an absolute crash-course in intensive data forensics for me. When I received the first set of data for these papers, I was a final-year PhD student overjoyed to have initiated my own independent collaboration with a more established scientist. Science is built on trust, and we all trust that our co-authors perform their parts of the collaboration as accurately as possible, to the best of their abilities. So at the time, I walked through my regular data exploration techniques (looking at the spread, looking for outliers, etc) and nothing popped up as unusual. I’d like to think that now as a more established scientist my data exploration and interrogation methods have already improved from where they were 5-6 years ago. But suffice it to say that from here on out, any data sets I receive (or produce) will get a full strip-search: check for duplicates, check for duplicated sequences, look for any too-precise relationships among different behavioral measures. PO Montiglio and I (& others) have already been discussing building a small R package that could look for the more complicated problems like those we found in these data that we hope could be useful to help others avoid horrible situations like this.
I am now starting my own lab at UC Davis and I know that this experience will prove to be incredibly formative for me and hopefully my future lab members as well. I have always tried to be as rigorous and careful as I can be in the science that I do. Each year, I learn about and then attempt to incorporate new protocols to make my science more open and transparent. I am a consummate note-taker, schedule-maker, and photo-taker. I used to upload my data when it was required, but in the past few years, I am now doing it as default. Last year, I made a resolution that I would upload all the R code I used for analyses in my papers. I’d like to take a moment to strongly encourage this as standard practice for all scientists; analysis is such a critical step of any experiment and the more eyes I can get looking over what I did, the better. Science thrives in the light of day!
And finally, thanks to everyone who has been so incredibly supportive and empathetic to me during this whole thing. There are no words that could do justice to how appreciative I am to be surrounded by, (and get to work with!) such incredible scientists and humans. Dan Bolnick may indeed be one of the kindest humans on this planet; thanks for guiding me through this process with patience and support.
I still really love the social niche specialization hypothesis. I just think it’s so cool and really resonates with our own human experiences as social creatures. I used to be very proud of this series of papers as strong evidence that these social niches exist, at least in social spiders. That may still be case. But it is clear that the data in these papers can’t be trusted to support that anymore. Please do not cite them again.
I really hope someone somewhere decides to follow up this work and test this hypothesis again. Please tell me what you find. I’d love to know.
UPDATE (Feb 7, 2020)
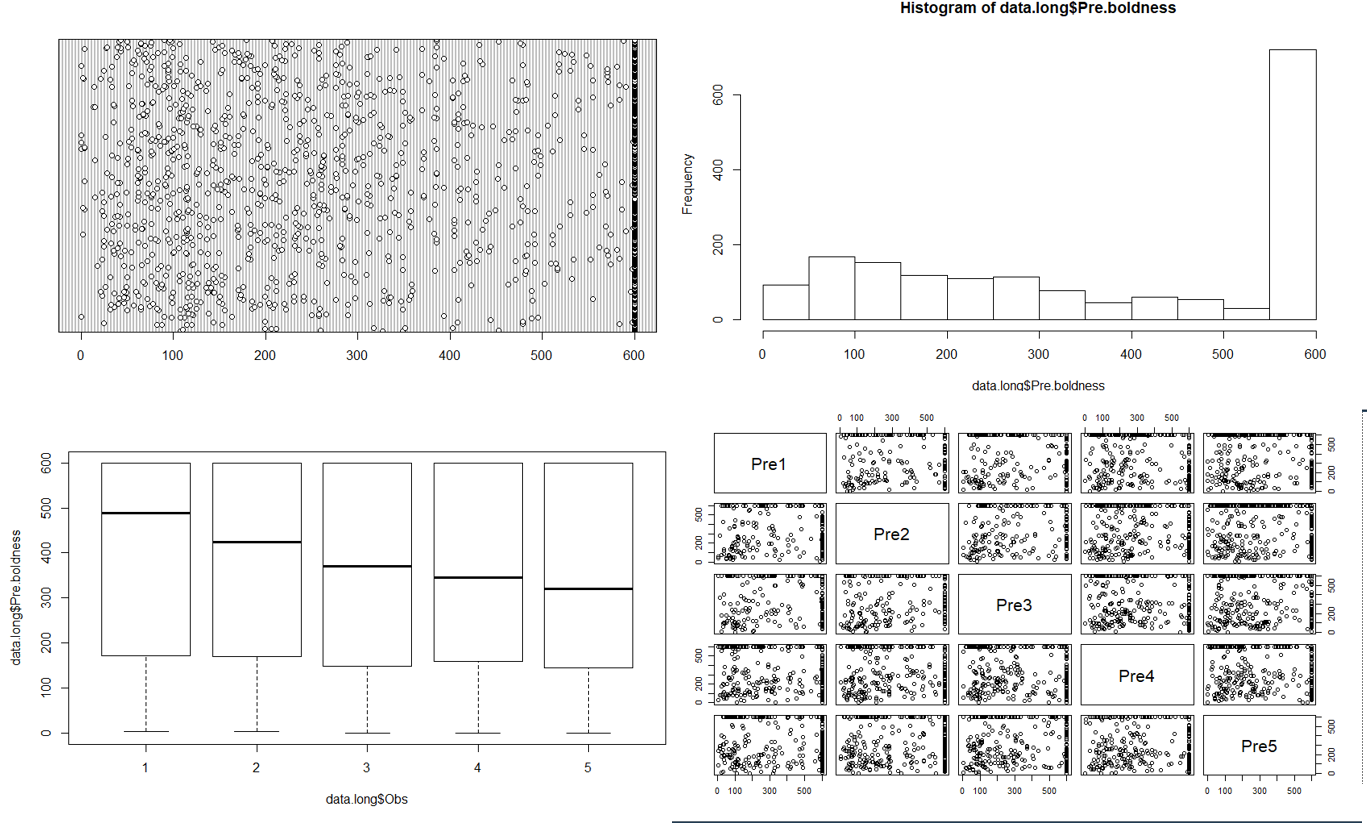
There has been some questions of why I (and others) didn’t catch these problems in the data sooner. This is a valid question. I teach a stats course (on mixed modeling) and even I harp on my students about how so many problems can be avoided by some decent data exploration. So let me be clear: I did data exploration. I even followed Alain Zuur’s “A protocol for data exploration to avoid common statistical problems“. I looked through the raw data, looking for obvious input errors and missing values. But in datasets with this many numbers most exploration has to be graphical. So as I do with all my data, I saved it as a .csv and imported it into R and then ran the standard series of graphical explorations. I am copying some of these below (dotchart, histogram, boxplot and pair plot across the pre-treatment observations). In addition to these, I plotted the the behavioral data within colonies, within treatments, I plotted body size and mass against behavior, I looked at individual reaction norms, etc etc. Altogether, I was left with the conclusion that there was good variation in the data, no obvious outliers or weird groupings, and an excess of 600 values which was expected due to the study design. As a scientist, I know that I have a responsibility to ensure the integrity of our papers which is something I take very seriously, leading me to be all the more embarrassed (& furious) that my standard good practices failed to detect the problematic patterns in the data. Multiple folks have since looked at these data and came to the same conclusion that until you know what to look for, the patterns are not obvious.
As I move forward from this, the question on my mind (and many others) is what else should or could be done in the future? I’m open to suggestions! I think it is more productive to focus on this, rather than its corollary of what could (or should) have been done in the past. The only things we *could* have done would have been done if we assumed that we did *not* trust the data provided by our collaborator. But we did. And we should continue to trust future collaborators, though obviously, not blindly (the eco-evo blog is producing a good series of ideas around this topic). This is not to say that there are not lessons to be learned here going forward. The most important lesson, to me, is the further need for more open and transparent science. As I mentioned previously, I was already committed to this goal, but am even more so now. Such practices will certainly help catch and correct honest mistakes when they happen in the future and hopefully increase trust among scientists and the public in general. But, and here is the critical thing, this will only help those people that follow and value such practices! While I can’t say exactly what happened here, bad actors will always find ways to game the system no matter what, that is literally what bad actors do. And while we may not catch all bad actors, each step we take towards making science more open should help make their lives a little bit harder, and hopefully ours a little bit easier.
UPDATE (Feb 19, 2020)
A third paper in this series testing for the presence of social niches in social spiders (Modlmeier et al. 2014 “Persistent social interactions beget more pronounced personalities in a desert-dwelling social spider”) has now also been retracted.
Bergmüller, Ralph, and Michael Taborsky. “Animal Personality Due to Social Niche Specialisation.” Trends in Ecology & Evolution 25, no. 9 (September 1, 2010): 504–11. https://doi.org/10.1016/j.tree.2010.06.012.
Laskowski, Kate L., and Alison M. Bell. “Strong Personalities, Not Social Niches, Drive Individual Differences in Social Behaviours in Sticklebacks.” Animal Behaviour 90 (April 1, 2014): 287–95. https://doi.org/10.1016/j.anbehav.2014.02.010.
(RETRACTED) Laskowski, Kate L., and Jonathan N. Pruitt. “Evidence of Social Niche Construction: Persistent and Repeated Social Interactions Generate Stronger Personalities in a Social Spider.” Proceedings of the Royal Society B: Biological Sciences 281, no. 1783 (2014): 20133166.
(RETRACTED) Laskowski, Kate L., Pierre-Olivier Montiglio, and Jonathan N. Pruitt. “Individual and Group Performance Suffers from Social Niche Disruption.” The American Naturalist 187, no. 6 (June 1, 2016): 776–85. https://doi.org/10.1086/686220.
(RETRACTED) Modlmeier, Andreas P., Kate L. Laskowski, Alex E. DeMarco, Anna Coleman, Katherine Zhao, Hayley A. Brittingham, Donna R. McDermott, and Jonathan N. Pruitt. “Persistent Social Interactions Beget More Pronounced Personalities in a Desert-Dwelling Social Spider.” Biology Letters 10, no. 8 (August 31, 2014): 20140419. https://doi.org/10.1098/rsbl.2014.0419.
Montiglio, Pierre-Olivier, Caterina Ferrari, and Denis Réale. “Social Niche Specialization under Constraints: Personality, Social Interactions and Environmental Heterogeneity.” Philosophical Transactions of the Royal Society B: Biological Sciences 368, no. 1618 (May 19, 2013): 20120343. https://doi.org/10.1098/rstb.2012.0343.