Some of my recent experiences have really hammered home the importance of performing science in as open and reproducible a manner as possible. The good news is that I actually think my experiences have provided a bit of a watershed moment for the field of animal behavior and behavioral ecology in general. It’s just become so apparent that employing open and reproducible practices are critical for maintaining our own, our colleague’s, and the general public’s trust in the data we collect.
The Animal Behavior Society recently held their annual meeting, virtually (summer 2020). Part of this meeting included a symposium (co-organized by Esteban Fernandes-Juricic and Ambika Kamath) on “Research Reproducibility”, in which I was invited to present a talk on a topic of my choice. I decided to focus on data management practices as our data are really the life-blood of research – trusting it forms the very foundation for the knowledge we produce.
The goal of such practices is so that you, or someone else, could trace every step of your data’s life from the day you collected it until the day you publish it. I always thought that I was pretty good about keeping a paper trail for my data, but wow, it’s so clear now that I still have so much room for improvement! Here, in my talk, I outline the (very) basics of best data management practices. There are far more sophisticated methods that folks could use, but my goal here is to outline some easy practices that anyone could start doing today and hopefully have relatively low learning curves or activation energy.
I’m elaborating on some of my points below because, well, a 6-minute talk is not nearly long enough! These are my current best practices for how I handle my data (Oct 2024 note: and I’ve now updated this post at least twice as I continue to find ways to improve!), but the great news is that new techniques and tools are being developed all the time to help automate, streamline and improve this process so I expect this may change. But, here are some starter parenting tips for taking care of your beautiful baby data!
1 – Maintain hard copies of data collection.
This will often be videos or photos or paper data sheets. At the very least, also include a hardcopy lab notebook where you list when, where and how you collected the data. Make sure to include any changes you make to protocols and why. Describe anything unexpected that happens or problems that arise. Have a calendar or schedule of when/how data collection happened; trust me, you absolutely will forget these details at some point. Take pictures of your set-ups; these are not only good proof that you said what you did, but also really useful for presentations.
2 – File naming & management
Imagine … someone asks you why some data in your deposited datafile on a paper you published five years ago are sort of weird. You know you kept lots of records on the experiment so it should be easy to figure out the answer right? Wrong. At least if you don’t have good file management practices. Seriously, go look through the folders of a project you did five years – do you know which files show your experimental design? What about what was the actual code you used to create the exact results in your paper? Which of the potentially tens of different data files did you actually analyze for the results you present in the paper? Or even just what was the submitted version of the manuscript file?
Being able to recreate your data’s lifecycle starts with having a really well organized and well named file structure. There are lots of ways that you can do this, but I’ll provide you with my method in case you need some inspiration. The key is really consistency and detailed README file, as I’ll explain.
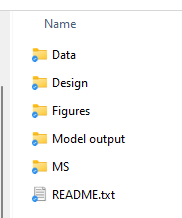
For me, each project gets a folder with the project name (e.g. “Project X”). Within this main folder, I create sub-folders for what I consider the big parts of the project. But the most important part of this folder is the README file. The README is a text file that should tell you (at a minimum):
- Where any biological samples are stored, e.g. blood samples are in XYZ freezer shelf, raw videos from the tracking system are on ZYZ hard-drive
- Overview of the metadata of the experiment which tells you what does each variable in your data files mean
- Overview of the overall file structure – which files are used for the published analysis etc
- Any other important details (e.g. for me, I took over data analysis of a project once a postdoc left so I highlight that in the README so we know who to contact about what steps of the project)
Then you can put all your relevant files in the appropriate folders. A key note here is that I really recommend doing some ‘version control’ for your files too. Basically – never just ‘save’ a file, but always ‘save as’ and then append the date to the end of the file name as YYMMDD. This will help keep all your files in order and also helps prevent you from writing over something important (i.e. you thought you were correcting a mistake in the datafile but actually you ended up making more mistakes!).
I also eventually often create an “old files” folder in here too where I’ll dump…. old files which I’m no longer actively using but don’t want to delete. This helps keep your folders a bit more streamlined and avoid having dozens and dozens of files clogging things up.
3 – Data entry.
If moving from hard-copy data sheets to digital format, then data entry is when lots of transcription errors will almost assuredly occur. You need to double check everything. Enter the data as carefully as you can, and then a day later go back through IT ALL. But go through in a different way then you entered it – start at the end of the data, or check columns on the far right first. It’s too easy to get your eyes into a groove where they quickly slide over the numbers without really seeing them.
4 – Handling many versions of data files.
For me, this means I will create an .xlsx and label it as something like “Project X_data_raw_DO NOT ALTER.xlsx” – as the name says, I basically should never touch this file ever again. Importantly, make sure that this file also includes all the meta-data. I usually just save this on a second sheet in the excel file. The meta-data should have a brief synopsis of what this data set is, how it was collected and by who, who entered it and then list every single variable and define what they are. Years (or even months) later it may not be super clear what “propMoving50” is supposed to be a measure of, or whether the 0’s in your “sex” category are females, or males. This information should also be included in your README file (redundancy is your friend).
I then save a second copy that is called “Project X_data_analysis.csv” which is the file that I will start with for my analysis (remember .csv files also only save 1 sheet so your meta-data will not be included in this file, hence why you need to have the “DO NOT ALTER” version above).
And while I think it’s best to do any alterations to your datafile within your scripting language (as then you can completely reproduce what you did), sometimes you do need to change the original datafile for various reasons. In this case, NEVER OVERWRITE (SAVE) YOUR DATA FILE. ALWAYS ‘SAVE AS’ and append the date at the end YYMMDD. This way you can track any changes you make over time and recover earlier versions if you accidentally did something wrong and need to go back.
I use other little file naming conventions such as adding ‘FOR DEPOSIT’ to end of the file that I know will, surprise surprise, eventually get deposited with the manuscript when it’s published.

Unfortunately, it is still super easy to accidentally corrupt any sort of editable file (be it xlsx or csv files) through copy-paste errors or dragging columns or whatever. So because I am now super anxious about this, it might not also be a bad idea to save your data (if possible) in an un-editable format (e.g. in pdf format). Yes, it would be absolute hell to have to re-create your excel file from a pdf file but this is insurance for you for any digital doomsday scenarios where things are lost or get corrupted beyond recognition. Even better if you can email it yourself so you have a time-stamp of when you created the file.
5 – Cleaning & analysis in R.
There are lots of different programs to analyze data. For the most open and reproducible methods, you need some record of exactly what you did. Here using some sort of scripting statistical software will be super helpful. I use R. I try to do all my data cleaning/formatting in R as it’s more reproducible. This way if you have my “Project X_data_analysis.csv” dataset and my R code, you should be able to load this up, and then see all the cleaning/formatting I do (I usually use things in the tidyverse to do this), and then all the statistical tests I perform. The code itself it obviously critical, but just as important are the annotations you will make. Annotate your code! Explain what you want to do, and why in your code. Trust me when I say that if you need to go back to your code after 6 months, a year, or 6 years, you will very much forget what you were doing. Your annotations are a gift to your future self. Be kind to your future self!
You will probably have several analyses you may want to do and you may end up changing your code lots of different times in all different ways. Keeping track of all these changes in your code can be tough. Here Github is a true life-saver. Github will keep track of all your versions of your code and let you see when any changes were made to your code and by who (especially important if you’re working within a collaboration). I will be honest and say that I have not yet fully incorporated Github into my analysis pipeline, but that this is my new year’s resolution. If you want to also learn Github, let me know and we can make a pact by the next ABS meeting in 2021, we’ll both have learned it! There are boatloads of good tutorials online like this one, or this one. (UPDATE May 2021: I have learned Github! I am now using Github for version control for my Rcode which is essentially seamless with the Github desktop app. Highly recommend! I am sure I am now yet fully utilizing all of Github’s functionality but am very pleased with how it’s working for me so far.)
If you are not using Github for automatic version control, then using some sort of manual version control like this for your R code is probably a good idea. So when you add/remove big things to your R code don’t just ‘save’ the new file but make sure to ‘save as’ with a new date YYMMDD at the end of the file name so that way if/when you break your code later, you can go back and find out what you did wrong.
SHORT ASIDE – there are so many potential pitfalls that can occur during analysis that can also lead to problems with reproducibility. Things like p-hacking or HARK-ing (Hypothesizing After Results are Known) are rife in science, and our field too. Maybe one day I’ll write a post summarizing my thoughts on this, but for now, all I can say is that in the same way you want to be transparent and reproducible in how you handle your data, you need to be transparent in the analyses you do. Be very honest in your papers about which results you tested for from a priori hypotheses (that you should have written down in your lab notebook before you even started collecting data) and which results you discovered in your data during the analyses (and are exploratory in nature).
6 – Finalizing results & figures and publishing!
After your analysis is complete, you should finalize your code so that it reproduces exactly the results you will put in your paper. For me, I now always produce an R markdown file at this point. So I clean up my scripts, annotate everything really well and then re-run everything on a clean session (i.e. nothing already saved in R’s memory) to make sure that I am reproducing the results I expected. I always find mistakes/errors/inconsistencies at this point. R Markdown is great as it will join together each piece of code with the output it produces so you can see it all in one place. You can also add in extensive notes in between the code chunks creating a really nice narrative that is very easy for someone else to read without them having to load up your R script and run your code themselves. You could also just use your final R script (which should be easy to find if you use Github!) though this requires a reviewer to actually run the code themselves to reproduce your results which is tedious.
Also, when I know that I will eventually be depositing this code/R Markdown file online, this knowledge just makes me more careful. Knowing that your work will become open for everyone to see is a little (lot) bit scary and I think that’s a good thing. It gives us the extra motivation we need to check and double-check everything we do and to make sure that our choices along the way are well justified. I’ve been seeing lots of chatter on twitter lately with folks saying they actually send their code to a co-author and ask them to check/run it to look for errors; this seems like an excellent idea!
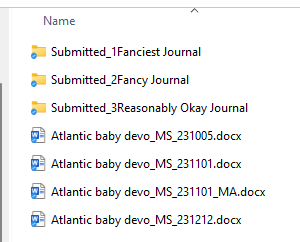
And just a heads up that I find the same file naming system I use for my datafiles to be really useful in managing the many versions of the MS you inevitably produce. Who among us has a folder with files named something along the lines of:
“MS_final.docx”
“MS_final FINAL.docx”
“MS_final for real this time.docx”
Instead what I do is append the date in YYMMDD format for each version of the MS. Then if the manuscript includes comments from say, co-authors, I put their initials at the end. When I incorporate their comments, the file gets a new date and voila, I can perfectly track the evolution of the writing. I also create folders for each submission. And then sub-folders within for the inevitable re-submissions. Once a paper is accepted, I put ALL the files that will be deposited with that paper (the MS, the code, the data, the R markdown etc) in the same folder so it’s a one-stop shop if I ever need to revisit that project down the line.
7 – Deposit everything.
Once you submit your paper, it should be accompanied with at least 3 key files 1) your data, 2) your code and 3) your R Markdown file. The code and data are paramount, but this also means that any reviewer/reader would need to load and actually run your code to reproduce your results which is not always feasible. The Rmarkdown is thus great because it shows all your results without having to run the code itself! Depositing your data & code in a repository like Dryad or Figshare means that other people can check your work, but just as importantly, that they can learn from you! How annoying is it when you read a paper that did *exactly* the analyses you want to do, but they didn’t include their code so you’re stuck sifting through Stats Exchange for weeks trying to fix your syntax problems. Ugh. We all don’t need to reinvent the wheel. Sharing code is good scientifically as we can learn from each other, but potentially also good personally in that folks can now cite you not just for your results, but also for your code.
So that’s it! At the end of all this, at a bare minimum, you should have all those (versions of) files to help you trace the life cycle of your data and your published manuscript will (at a bare minimum) be accompanied by
- the FOR DEPOSIT data file
- the final r CODE you used
- a compiled r markdown PDF that shows the output of all your code
Be a good parent to your precious data !
Documenting our data’s journey as carefully as we can from collection to publication is so critical for so many reasons. First, we are scientists. We live and breath by the data we collect and so taking good care of it and proving that we’ve done so is sort of a no-brainer. It really isn’t something that needs any justification. If we consider ourselves natural skeptics who want to be able to see the evidence for ourselves, then isn’t this just part of our jobs?
Second, it protects ourselves. Being open from the very get-go makes it very difficult for others to insinuate you are doing something inappropriate. This is sort of an unpleasant to thing to think about, but as there are now several high profile examples of allegations of negligence, misconduct or full-on fraud, it’s not a bad idea to be a little bit proactive about protecting yourself. This way any mistakes that do happen or irregularities that may appear in your data, hopefully have an explanation that you can quickly trace. Mistakes *will* happen, we are humans and it is inevitable. But much better for it to be an obviously honest mistake than having any whiff of it being something else…
Third, along these lines, knowing that you are performing your science in a glasshouse will make you a better scientist! Just like how you finally see the typos in your manuscript (or blog post!) right after you click submit (and know someone else is going to see it), I think the same principle holds for all other parts of science, including the collection and the analysis. Thinking about how we justify all the decisions that go along with data collection, cleaning and analysis as we are making them and carefully documenting this will make our work more rigorous and reproducible.
8 – Other resources:
- Open Science Framework. Finally, all these practices are basically things you do yourself. Another option is to use the Open Science Framework. This website lets you create an account (for free!) and then you can basically load everything for your project there. I haven’t yet adopted this framework for my own work, but I wouldn’t be surprised if I did at some point. Especially when I start managing more projects through my students. Something to consider!
- SORTEE. Some very cool folks recently started the Society for Open, Reliable and Transparent Ecology and Evolutionary Biology (SORTEE) as a society to advocate for, well, open, reliable and transparent research practices in our fields! Their website has oodles of good resources for you if you want to learn more about current best practices and they host frequent webinars/hackathons/conferences that let you learn about new techniques and network with other folks interested in rigorous research practices.